Are Electric cars worth it?
We think we finally have an answer to the age-old debate about Electric cars (EV). In fact, thanks to the work of our friend, the Italian Engineer Luigi Argese and “I.SE.T. S.c”, we have a great amount of data collected during a period of 8 years, in which the same driver has driven a 1.6 Diesel Lancia Delta for the first 4 years and a 28kWh Hyundai Ioniq for the last 4 years.
Engr. Argese has compared the data and shared the results with us. We’re going to summarise them in this article but, if you’re interested in the full version of his work you can find a Google translated version here or you can find the original Italian version here.
1. Diesel vs Electric
As stated before, this article contains the real data collected by ISET in the use of a Hyundai Ioniq EV 28 kWh MY 2019 in Puglia, Italy for four years.
These data were compared with those recorded by the same driver with his previous car, a Lancia Delta 1.6 MJTD Euro 5. The data are comparable because the destinations and driving style stayed the same. Furthermore, the data analysis was carried out over a period of time coinciding with exactly four years (the first four years of the car’s life), so that the climatic conditions, which have a significant influence on the consumption for electric cars, were not a factor in the study carried out.
2. Data reliability
The purpose of the proposed study is to provide reliable data on the running costs of one of the best electric cars produced so far, if not the best for general efficiency, compared to those of a modern Euro 5 diesel car.
Considering that there are many differences between one electric car and another (much greater than the differences that can be appreciated between two different diesel cars, for example), it is recommended to use the data reported only if an electric car is considered of the same model or at least with the same technology (other cars in the Hyundai range adopt a technologically similar power pack).
3. Consumption and Performance
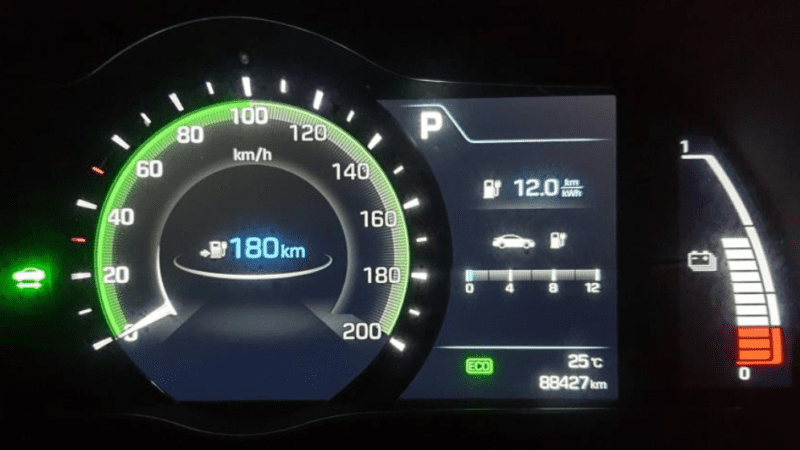
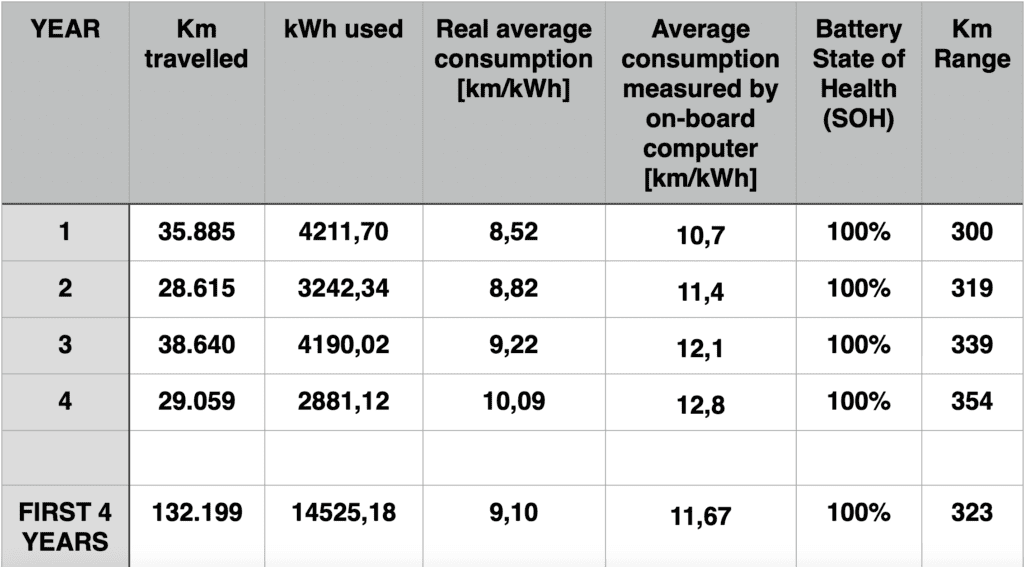
In four years, 14,525.18 kWh were needed to travel 132,199 km. From this total figure it is possible to calculate an average consumption of 9.10 km/kWh. In reality, according to what was detected by the on-board computer, the Hyundai Ioniq EV traveled on average 11.67 km with one kWh.
Why this difference?
Not all of the energy withdrawn during a recharging cycle is stored in the battery. The so-called “charging efficiency” is calculated from the ratio between the stored energy and the one withdrawn and depends mainly on the quality of the charger. For the Hyundai Ioniq EV under review, the average charging efficiency over the first four years was 77.9%. Considering that the efficiency of an electric car is around 90%, the overall efficiency of the system is around 70%.
This value is huge if compared to the efficiency of the Lancia Delta 1.6 MJTD, that, at a constant speed of 100 km/h, is equal to 35.6% (consider that this is an excellent value for a car with an internal combustion engine, because there are also other models with an efficiency of less than 30%). This means that less than 30% of the calorific value of the fuel is converted into mechanical energy, therefore the electric car is more than twice as efficient.
kWh consumption over the years

In the table above, it is clear an important and progressive decrease in consumption, which corresponds to a significant increase in autonomy.
Wait, what?
You would expect efficiency to decrease with the age of the vehicle but this is not the case here.
Firstly, regeneration under braking can greatly influence the performance of an electric car. If the driver is used to drive a car with an internal combustion engine that doesn’t have this feature will most likely need time to adapt and use the system in the most efficient way. An expert electric drive is the first element that causes this pleasant phenomenon. There’s also other aspects, for example keeping the right tyre pressure all the time, as well as not carrying heavy and unnecessary objects on board, which would increase the weight and consumption.
One other aspect, that happens in all cars over the years, the friction of the mechanical parts is reduced over time, as they settle down. In the second year, thanks to expert driving and adjustment of the mechanical parts, consumption improved by 3.5%. While the settling partly explains the reduction in fuel consumption in the second and third years, however, it is unlikely that it had an equally significant effect in the fourth year, given that the car had already covered an impressive 103,140 km.
Among the elements acquired and worthy of being highlighted, we have identified a third cause of the reduction in consumption: the replacement of tyres, which took place at 73,079 km. The original equipment consisted of very smooth Michelin Energy Saver, a tyre with a low friction coefficient, a feature that significantly affects fuel consumption. In the meantime, however, the same manufacturer has developed a new tyre inspired by the Energy Saver model, with the aim of further increasing its smoothness: thus the Michelin e.Primacy model was born. Even if the first 8579 km of the third year were covered with the same tires as the previous years, the difference was such as to allow for a further improvement in consumption in the third year, quantifiable in a good 4.5%. In the fourth year, the same set of tyres was always used for all the kilometers travelled.
4. Charging
The average charging power during the 4 years was 2.43 kW. The recharges were mainly carried out at night using the recharging device supplied with the car or via wall charger. The power chosen to charge the car was so low because it preserves the battery as fast-charging accelerates the battery pack degradation.
5. & 6. Other management costs: Rego and scheduled maintenance
This study was carried out in the south of Italy so the data related to the incentives is not to be taken under consideration for an Australian driver but there are similar incentives even Down Under and they’re slightly different from state to state.
In South Australia for example, there’s a 3-years free registration period and rebates for the purchase of the vehicle and the installation of a home EV smart charger [no longer in place].
Scheduled maintenance.
In 4 years, a scheduled service was carried out every year, costing € 72.00 (on 12/30/2019), € 115.00 (on 12/23/2020), € 103.00 (on 09/13/2021) and €100.08 (on 09/14/2022). An average annual cost of €97.52 is deducted for routine maintenance.
On the diesel car in comparison, the logbook service was performed annually and the average cost was €450.00. Even though the data comes from a different country, it is easy to compare to our markets prices. Just think of the cost of your average service on your diesel car and divide it by 4.
This test only considered the first 4 years of life of the two vehicles. Just imagine how much more is going to cost a service on a diesel car when it’s time to replace the timing belt kit or the water pump, parts that an electric engine doesn’t have.
7. POLLUTION
In this chapter, our friend Luigi compares the emissions of the two test vehicles in 132,199 km. To do so, he took under consideration also the CO2 emitted for the transport of both diesel and electricity. Without getting too in-depth with the numbers (remember to follow the link above if you want to read the whole study) the diesel vehicle produced more than 5.61 times the emissions of an electric car.
The study also considers the life cycle of the 2 vehicles and how much is going to cost to dismantle and recycle both cars.
This brings us to another important topic about electric cars:
How are Electric engines and battery packs going to be recycled?
Luigi comes to the rescue telling us that the electric motor is reusable as it does not show any significant wear and tear and, in any case, most of its components can be recycled.
Even the battery can be completely disassembled from the EV and 99% of its materials can be recovered. Although specialised centres for recycling electric car components are not yet widespread today, it is undeniable that, unlike the traditional car, it is suited to a circular economy model.
Conclusion
From this direct experience, the superiority of the electric car is evident. In addition to the unparalleled driving pleasure, the performance (the instant torque production), the silence (it will also reduce noise pollution in urban centres), the better weight distribution, the low centre of gravity (the battery is located under the floor), the aerodynamics (thanks to the absence of large radiator groups in the engine bay), the economic and environmental benefits are also incredible.
We hope this article helped our readers understanding the differences between electric cars and traditional cars and it will guide you towards your next car choice. You have now an answer to the question:
“Are electric cars worth it?”


